Azure Netflix Data Engineering Project
- Jesse Pepple
- Oct 3, 2025
- 6 min read

Updated: Jan 8
In this project, I implemented Unity Catalog in Databricks to establish secure, centralized data governance, ensuring controlled access and compliance across all datasets. The solution leveraged Delta Lake and Delta Tables to provide scalable, reliable, and efficient storage, while the pipeline followed the Medallion Architecture (Bronze → Silver → Gold) to maintain data quality, reliability, and usability at every stage.
The end-to-end workflow utilized Azure Data Factory for orchestration, Azure Data Lake Storage for raw and curated data storage, Azure Databricks for transformations, and Azure Synapse for analytics and reporting. To streamline processing and automate the flow, I used Delta Live Tables, ensuring data was consistently served to the SQL Data Warehouse. Throughout the project, I relied on Python and SQL for data transformations and scripting, turning raw data into curated, business-ready datasets ready for analysis.
Goal: Implement secure, centralized governance for datasets across the Medallion Architecture.
KPIs & Metrics:
Unity Catalog: ✅ Created netflix_catalog for structured data governance
Access Control & Lineage: Enabled on Bronze, Silver, and Gold layers
External Locations: Configured credentials to map to ADLS containers
Result Statement:
Established a governed and auditable data environment, ensuring secure access, data lineage, and centralized management of all datasets. Azure Services:
Azure Databricks
Azure Data Factory (ADF)
Azure Data Lake Storage (ADLS Gen2)
Azure Synapse Analytics
Azure DevOps (for CI/CD)
Databricks Components:
Delta Lake & Delta Tables
Unity Catalog (data governance)
Delta Live Tables (DLT) for automated ETL
Databricks SQL Warehouse
Languages & Tools:
Python (PySpark / notebooks)
SQL
Overall Project Impact
End-to-End Pipeline: Bronze → Silver → Gold, with DLT automating ETL
Governance & Security: Unity Catalog ensures access control and lineage
Incremental & Dynamic Loads: Parameterized pipelines reduce runtime and manual intervention
Business Value: Analysts and BI teams can efficiently access high-quality datasets for reporting and insights
Portfolio Highlight: Demonstrates expertise in cloud data engineering, governance, automated ETL, and BI integration
Project Architecture

Creating And Ingesting Raw Data with ADF
After provisioning the required resources, I built a parameterized, dynamic data pipeline to ingest the five datasets needed for the project. The raw data was ingested efficiently and stored in the Bronze container of Azure Data Lake within my resource group, establishing a reliable foundation for subsequent transformations and processing in the Medallion Architecture.


To efficiently ingest the datasets, I leveraged Azure Data Factory activities such as Lookup, Get Metadata, ForEach, and Set Variable. These activities enabled dynamic, parameterized processing, allowing the pipeline to handle multiple datasets automatically while maintaining flexibility and scalability throughout the ingestion process.
Goal: Efficiently ingest multiple Netflix datasets into the raw (Bronze) layer.
KPIs & Metrics:
Parameterized ADF Pipelines: Automated ingestion of 5 datasets
Data Storage: Raw data ingested into Azure Data Lake Bronze container
Dynamic Loading: Data pipelines handled incremental files efficiently
Data Validation: Initial ingestion verified; no missing or corrupted records
Result Statement:
Implemented a fully parameterized and dynamic ingestion pipeline, ensuring scalable and accurate loading of raw Netflix datasets.
PHASE 2 TRANSFORMATION
To begin with Unity Catalog, I created a catalog named netflix_catalog and configured the necessary credentials and external locations, linking them to the corresponding container in the data lake. I then built a parameterized jobs pipeline in Databricks to ingest the five required datasets for the project. Once the data was ingested, I moved on to data transformations, which involved detailed cleaning, restructuring, and preparation to ensure the datasets were ready for downstream analytics—an intensive but crucial step to maintain data quality and usability.


Goal: Clean and enrich datasets for analytical readiness.
KPIs & Metrics:
Data Transformation: PySpark notebooks processed all 5 datasets
Parameterized Job Pipelines: Enabled efficient repeated transformations
Data Quality Checks: Handled schema alignment and null values
DLT Validation: Delta Live Tables validated transformations prior to serving
Result Statement:
Successfully transformed raw datasets into high-quality Silver-layer datasets, ready for downstream analytics.
Phase 3 Serving
After completing the transformation stage, the next step focused on data serving. I loaded the cleaned and curated datasets into SQL Data Warehouses for analysis and business intelligence reporting. To streamline this process, I utilized Delta Live Tables (DLT), a declarative framework for building ETL pipelines, which allowed me to validate code, automate transformations, and efficiently orchestrate the entire data pipeline, ensuring that high-quality, analysis-ready data was consistently delivered.

As shown by the diagram we have a dlt.table and afterwards rules were set for data quality checks


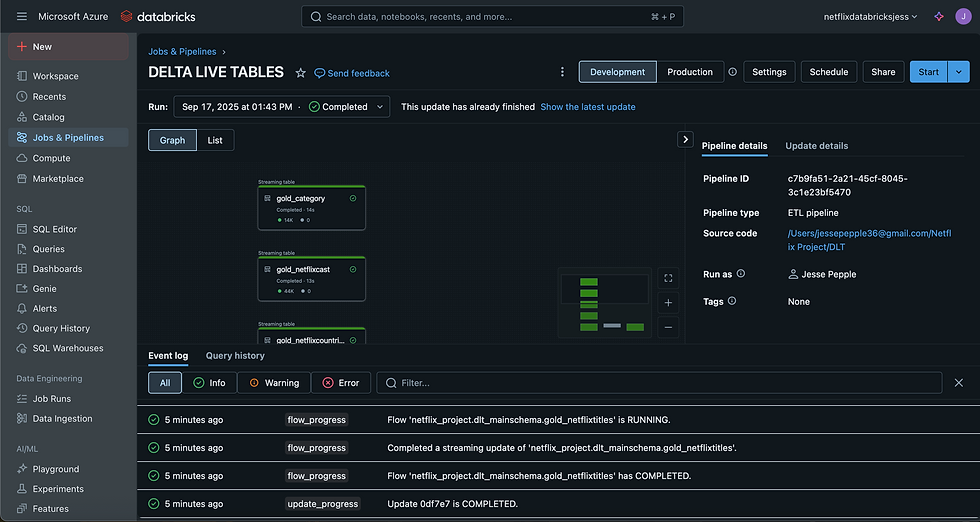
To validate the incremental loading logic, I attempted to load the data, fully aware that no new changes had occurred. As expected, the pipeline returned 0 new records, confirming that the incremental load process was working correctly and only processing new or updated data as intended.

Goal: Deliver analytical-ready datasets with automation.
KPIs & Metrics:
Delta Live Tables (DLT): Automated ETL pipelines orchestrated transformations
Data Serving: Cleaned datasets loaded into Databricks SQL Warehouse for analytics
Data Quality: Passed validation; zero dropped rows
Scalability: Pipelines designed for easy addition of new datasets
Result Statement:
Delivered fully curated Gold-layer datasets using DLT, ensuring automated, validated, and repeatable ETL processes.
SQL WAREHOUSE QUERYING AND BI REPORTING
With our Delta Live Table (DLT) pipeline live and the Netflix dataset fully cleaned, transformed, and placed in the Gold layer, I explored the data in the Databricks SQL Warehouse. This allowed me to validate the final output, run queries, and even experiment with creating dashboards, demonstrating that the pipeline delivered high-quality, analysis-ready data that could be immediately leveraged for insights and reporting.


Data Visualisation

BI Reporting
Thanks to Databricks Partner Connect, I was able to provide the BI connector to the Data Analyst, enabling them to directly query and visualize the cleaned Netflix data in Power BI. This streamlined the workflow, allowing analysts to access insights without relying on the SQL Data Warehouse, and demonstrated how the pipeline could deliver actionable, business-ready data efficiently and securely.
Github Link:
Now that we are at the end of my project walkthrough below is the link to my Netflix Github repository containing the codes, notebooks and details about our project
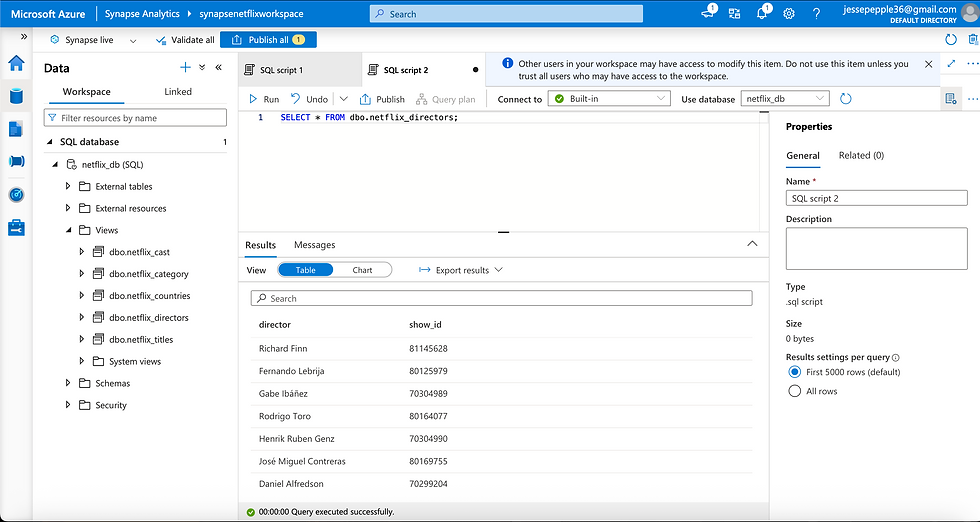
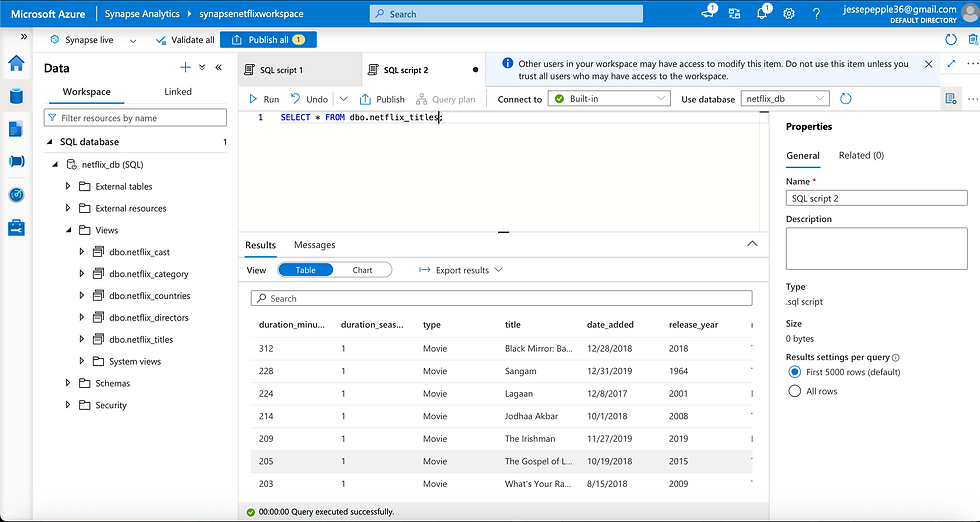
Loading In Synapse
Leveraging the OPENROWSET() function alongside Synapse Lakehouse capabilities, I created views of the cleaned Netflix data stored in the data lake and exposed them through a serverless database in Synapse. This provided Data Analysts with an additional way to query and visualize the data. Combined with the Power BI connector, SQL Data Warehouse in Databricks, and Synapse Warehouse, analysts now have multiple flexible options for accessing and analyzing the curated dataset, ensuring both usability and accessibility across the organization.


For the presentation layer in Synapse, I chose to use views instead of tables because they provide abstraction and simplicity, hiding the complexity of the underlying raw and transformed data while making it easier for analysts to query. Views are lightweight and flexible, allowing quick updates to schema or business logic without duplicating or reloading data. This approach aligns with best practices in modern data architectures, where tables manage persistence at the raw and curated layers, and views expose clean, business-friendly models to end users. For my GitHub portfolio, using views also better communicates design thinking, highlighting my ability to present data in a way that aligns with real-world reporting and analytics needs rather than just displaying raw storage as soon after completion of project resource group will be deleted, although in production and future portfolio project this would be a different case as there are major instance in data loading in Synapse Workspace, in which I will demonstrate my skills in creating and presenting external tables.
Goal: Make datasets accessible for analysis, reporting, and visualization.
KPIs & Metrics:
Databricks SQL Warehouse: Curated datasets queried and tested
Synapse Analytics: External views created with OPENROWSET for analyst access
BI Partner Connect: Enabled Power BI integration for direct visualization
Views vs Tables: Presented lightweight, flexible views for analysts → abstraction + ease-of-use
Result Statement:
Provided multiple access points for data analysts via Databricks SQL Warehouse, Synapse views, and Power BI, making datasets fully analyst-ready while maintaining abstraction from raw layers.


Comments