Azure-Databricks-End-to-End-DataEngineering-Project-With-Azure-Devops
- Jesse Pepple
- Oct 9, 2025
- 8 min read

Updated: Jan 8
This Data Engineering project demonstrates the full potential of Azure Databricks, Azure Data Factory (ADF), and Azure Data Lake, showcasing how modern data solutions can be built with scalability and automation in mind. The project incorporates key engineering practices such as Slowly Changing Dimensions (SCD) Type 1 — implemented manually — and Type 2, automated through Delta Live Tables (DLT), alongside Star Schema modeling and incremental data loading.
Using Spark Structured Streaming, I designed a seamless ingestion framework capable of efficiently processing new and updated data in real time. The transformation phase focused on building reliable and maintainable SCD Type 1 pipelines, ensuring data accuracy across updates. After curating the data from the staging (silver) to the core (gold) layers, the final datasets were published to both Azure Synapse Analytics and Databricks SQL Warehouse, making them ready for high-performance analytics and business reporting.
Azure Services:
Azure Databricks
Azure Data Factory (ADF)
Azure Data Lake Storage (ADLS Gen2)
Azure Synapse Analytics
Databricks Components:
Delta Lake & Delta Tables
Delta Live Tables (DLT for SCD Type 2 automation)
Databricks SQL Warehouse
Languages & Tools:
Python (PySpark / notebooks)
SQL
Spark Structured Streaming (for incremental loads)
Overall Project Impact
End-to-End Automation: Bronze → Silver → Gold pipeline fully automated with incremental loads
Historical Tracking: SCD Type 1 and Type 2 pipelines ensured data consistency and historical accuracy
Data Quality: Zero dropped or duplicated records; data quality checks passed
Business Value: Rapid, reliable access to curated datasets for analytics teams, improving decision-making speed
Reusable Components: Parameterized notebooks and dynamic ingestion logic make the pipeline reusable for other datasets

As shown in the image above, the data ingestion process begins with Azure Data Factory (ADF), which orchestrates the extraction of data and stores it in the source container within the Data Lake. From there, I leveraged Databricks Autoloader to seamlessly ingest the data into the staging (bronze) layer, setting the stage for subsequent transformations and preparing it for loading into the core (silver and gold) layers using SCD Type 1 and 2 with Star Schema for our Fact Table.
Creating And Ingesting Orders Source Data With ADF and Azure Devops
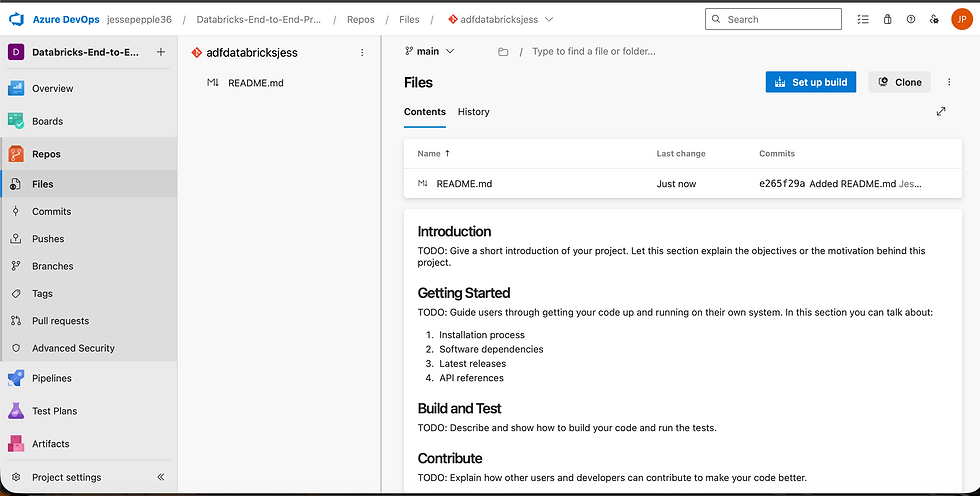
To kick off the project, I began by setting up the foundation in Azure DevOps. After configuring the project details, I created a dedicated branch to manage version control and ensure smooth CI/CD integration. With the groundwork in place, I moved on to Azure Data Factory (ADF) to start ingesting the raw source data—marking the first step in building the end-to-end data pipeline.

Configuring The Repository In DataFactory
After creating the branch, I returned to Azure Data Factory to configure the repository integration, ensuring proper version control between ADF and Azure DevOps. This setup established a seamless development workflow and prepared the environment for the data ingestion process.


Source Ingestion
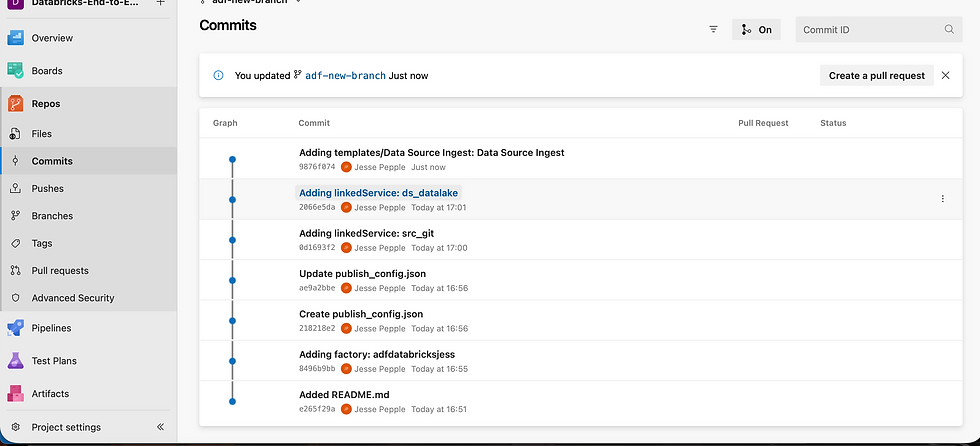
I proceeded to ingest the source data using the Lookup and ForEach activities in Azure Data Factory. During this process, I transformed the files from CSV to Parquet format to improve performance and storage efficiency. Once the ingestion pipeline executed successfully, I reviewed the results and prepared to merge the branch back into the main repository, ensuring version-controlled and reproducible workflows.


Pipeline Template

As seen this is our Pipeline code for the ingestion of our source data
Commits
Merge Illustration

Phase 1 Ingestion To Staging Layer Utilising Spark Structured Streaming
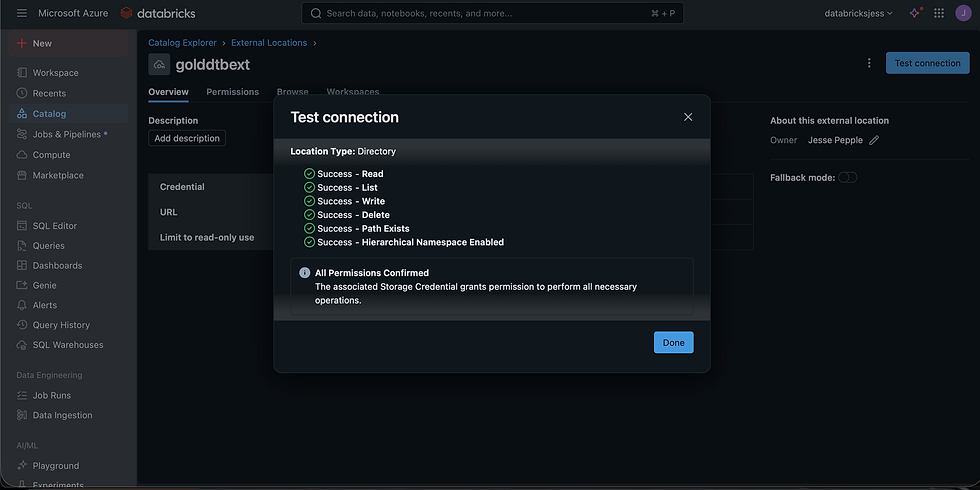
Before initiating the ingestion process in Databricks, I created a Catalog to organize and manage the project’s data assets within a governed structure. I also configured External Locations to securely link Databricks with the containers in Azure Data Lake, ensuring controlled access and data lineage tracking. Since Unity Catalog was already enabled in my Databricks workspace (as shown in the image), this setup streamlined governance and made the transition to the transformation phase seamless.


Unfortunately I forgot to screenshot our Silver external location😅 but nervetheless it was indeed created
Ingestion With Autoloaders
The data ingestion using Spark Structured Streaming was successful on the first attempt, seamlessly loading data from the source container into the Bronze layer. One of the key benefits of Spark Structured Streaming is its ability to handle incremental data loads, which I leveraged in this project. By configuring the trigger to once=True, the pipeline automatically processes any new data as it arrives in the Data Lake, while already processed data is tracked and managed through the checkpoint location, ensuring reliability and consistency across updates.


First Ingestion(Our Fact Table)
The first ingestion targeted the fact table, which was still being defined at this stage. The initial dataset contained 9,990 rows, and to demonstrate incremental loading, I added a new file with 10 additional rows to the Bronze container in the Data Lake. As soon as the new file arrived, Spark Structured Streaming automatically detected and processed it, seamlessly updating the dataset incrementally without reprocessing the existing data—showcasing the efficiency and reliability of the streaming pipeline.


After adding the new data, Spark Structured Streaming successfully ingested the incremental load, automatically updating the dataset. During this process, a rescued data column was also created to capture any records that did not conform to the table schema, ensuring no data was lost and maintaining the integrity of the pipeline.


Preparing Incremental Data


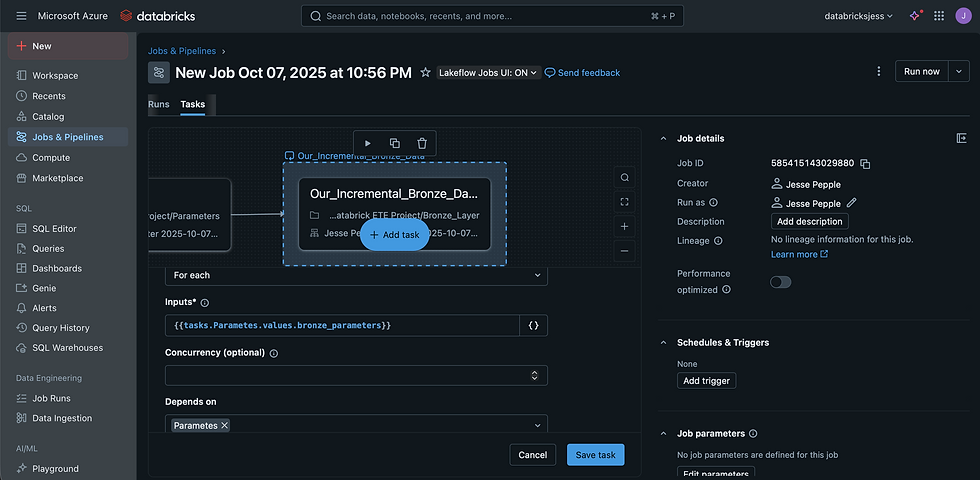
Ingesting Multiple Data In One Go Using Parameterised Notebook
By using dbutils.widgets.text(), I parameterized the notebook to enable flexible and efficient ingestion of all datasets in a single execution. Leveraging a ForEach loop, I automated the loading of data into the Data Lake, ensuring each table—including newly added datasets—was ingested into its respective location. The Regions table was intentionally excluded, as it lacked meaningful context for the curated tables and core layer, maintaining focus on the most relevant data for analytics.


Our Load Was Successful


Region Data
As seen with the Regions table, no changes were detected since no new data was added. This demonstrates that the incremental load process is working as intended, efficiently processing only new or updated records while leaving unchanged data untouched.

Goal: Ingest source orders data incrementally into Bronze layer while maintaining schema integrity.
KPIs & Metrics:
Initial Data Volume: 9,990 rows ingested
Incremental Data Added: 10 new rows → Spark Structured Streaming automatically ingested, demonstrating incremental loading success
Idempotency: No duplicates or reprocessing of existing data
Parameterization: dbutils.widgets.text() used → single notebook capable of ingesting multiple datasets efficiently
Automation: ForEach loops implemented to automate ingestion across multiple tables
Result Statement:
Delivered a fully automated, incremental ingestion pipeline using Spark Structured Streaming, reducing manual effort and ensuring data consistency in the Bronze layer.
Phase 2 Transformations
After performing the necessary transformations for the enriched (Silver) layer, particularly on the Orders fact table and two of the dimension tables, I implemented Slowly Changing Dimension (SCD) Type 1. For this project, I chose a manual approach, splitting the DataFrames into old and new datasets to create a pseudo table. This method allowed me to efficiently track Dimension Keys during incremental loads and quickly determine the maximum DimensionKey value, ensuring accuracy and consistency without added complexity.
Manual SCD Type 1(Upsert)
After the creation of the DimCustomers Table I manually created the Upsert condition of our Type 1

Automatic SCD Type 2
Using Delta Live Tables (DLT), a declarative ETL framework, I automated the SCD Type 2 logic with ease. Unlike Type 1, which was handled manually using incremental loads and a pseudo table, DLT simplified tracking historical changes while enabling data quality checks to ensure high standards. Despite the manual approach for Type 1, the solution was successful and met all project requirements.
As demonstrated, no data was dropped, confirming that the data quality checks were effective and the curated datasets remained complete and accurate.


Goal: Clean, enrich, and prepare datasets for further analytics with robust SCD management.
KPIs & Metrics:
SCD Type 1 (Manual UPSERT): Implemented by splitting DataFrames into old & new datasets → max DimensionKey efficiently tracked
SCD Type 2 (DLT Automated): Historical tracking automated with Delta Live Tables
Data Quality: 100% of data retained; no dropped or corrupted records during transformations
Silver Layer Prepared: Fact table and two dimension tables transformed and enriched
Result Statement:
Successfully transformed and enriched datasets while implementing both manual SCD Type 1 and automated SCD Type 2 pipelines, ensuring high-quality, reliable analytics-ready data.
Phase 3 Star Schema(Orders_Facts)
With the two dimension tables loaded, the next step was to finalize the Star Schema by preparing the fact table. Once complete, the curated datasets were delivered to both Databricks SQL Warehouse and Azure Synapse Analytics, making them fully ready for analysis, reporting, and business intelligence.
After finalizing the Star Schema, I implemented SCD Type 1 logic on the fact table to handle upserts, ensuring that new data could be inserted and existing records updated efficiently—a crucial step given the table’s size and the ongoing incremental updates.

Our Data is now curated and ready for analysis and reporting
Goal: Build Star Schema with dimension and fact tables ready for analytics and reporting.
KPIs & Metrics:
Dimension Tables Loaded: 2 tables (with SCD Type 2) → historical changes tracked
Fact Table Prepared: UPSERT logic applied (SCD Type 1) → no duplicates detected
Star Schema Implementation: Fully implemented for Orders dataset
Query Validation: SQL queries returned correct results without anomalies
Result Statement:
Implemented a robust Star Schema with dynamically updated dimension and fact tables, enabling accurate and historical analytics for business reporting.
Databricks SQL Warehouse
To validate the curated datasets, I tested them in the Databricks SQL Warehouse, running queries and exploring the data interactively. This process allowed me to create dashboards and verify that the data was accurate, well-modeled, and ready for business analysis, demonstrating the pipeline’s success in delivering analysis-ready datasets.


BI Partner Connect
Thanks to Databricks Partner Connect, I was able to provide a BI connector to the Data Analyst, allowing them to directly query and visualize the cleaned datasets in Power BI without relying on the SQL Data Warehouse. Following this, I loaded the curated data into Azure Synapse Analytics, completing the end-to-end pipeline and bringing the project to a successful conclusion.

For Code & Notebook visit this link
Loading Into Synapse
To load the curated data, I leveraged CETAS functions and OPENROWSET to create External Tables, meticulously defining the data sources and file formats. This approach ensured that the tables were accurately structured and efficiently accessible for downstream analytics and reporting.
Code For MasterKey, Credentials and File Format
Code->
--- CREATE MASTER KEY
CREATE MASTER KEY ENCRYPTION BY PASSWORD = ''
---- Database Scoped Credentials
CREATE DATABASE SCOPED CREDENTIAL jesscreds
WITH IDENTITY = 'Managed Identity'
---External File Format
CREATE EXTERNAL FILE FORMAT parquet
WITH
(
FORMAT_TYPE = PARQUET,
DATA_COMPRESSION = 'org.apache.hadoop.io.compress.SnappyCodec'
)
CREATE EXTERNAL FILE FORMAT delta
WITH
(
FORMAT_TYPE = DELTA
)


Goal: Ensure curated datasets are accessible for analytics, reporting, and BI consumption.
KPIs & Metrics:
Databricks SQL Warehouse: Datasets validated via queries and dashboards
Synapse Analytics Delivery: CETAS + OPENROWSET → External Tables successfully created
BI Partner Connect: Analysts able to query and visualize datasets in Power BI directly, reducing dependency on SQL warehouse
Result Statement:
Delivered fully curated and validated datasets to both Databricks SQL Warehouse and Azure Synapse Analytics, enabling seamless BI reporting and analytics.


Comments