End-to-End-Sales-Azure-Data-Engineering-Project-With-Databricks-AssetsBundle-CI-CD
- Jesse Pepple
- Nov 28, 2025
- 5 min read

Updated: Mar 22
This project showcases a complete end-to-end Azure Data Engineering solution, handling data from ingestion through transformation to delivery using modern, cloud-native best practices. The architecture leverages Azure Data Factory, Azure Databricks, and Delta Live Tables (DLT) to create a scalable, reliable, and production-ready data pipeline.
The pipeline is designed to manage incremental data ingestion, support schema evolution, implement change data capture (CDC), and enable dimensional modelingmaking it fully equipped to handle real-world enterprise workloads efficiently. Functions used in the enrichment layer were tested before deployments
Overall Project Impact
End-to-End Automation: 100% of the pipeline automated from ingestion → transformation → delivery, ensuring minimal manual intervention.
Version Control & CI/CD: All notebooks and pipelines managed via GitHub and Databricks Bundles, enabling reproducibility and seamless collaboration.
Scalability & Maintainability: Architecture supports additional data sources and schema evolution without manual updates, future-proofing the pipeline.
Business Value: Reduced manual ingestion errors and improved data reliability, enabling analysts to query curated datasets without engineering intervention.

Problem Statement
Many organisations struggle with data that sits across multiple systems, arrives in different formats, and updates frequently. Traditional pipelines are often brittle, manual, and difficult to scale.
The challenge was to build a pipeline that:
Handles continuous ingestion from source systems
Automatically adapts to schema drift
Supports Change Data Capture (CDC)
Delivers curated data models for analytics
Ensures reliability, auditability, and reproducibility
This project solves those challenges using a modern lakehouse approach.
Phase 1 Data Ingestion
The project kicked off by establishing a Git repository to enable version control and streamline deployment of the Azure Data Factory artifacts. A dedicated development branch was created to manage feature enhancements and isolate ongoing updates from the main production branch, ensuring a controlled and organized development workflow.

During the ingestion phase, data was sourced from a website via a REST API. The pipeline was fully parameterized in Azure Data Factory and executed using a ForEach activity to dynamically handle multiple API calls. The ingested data was then written to Azure Data Lake Storage, with a timestamp column included to provide context for auditability and support downstream processing.

As shown in the diagram, the data source was first validated using a Web Activity. After successful validation, the ingestion process was executed using parameterized ForEach activities to handle dynamic data retrieval. Once the ingestion completed, a pull request was created, reviewed, and merged into the main branch to maintain version control and ensure production readiness.


Result Statement:
Reduced manual ingestion errors and improved auditability, ensuring all incoming sales data was captured reliably and ready for downstream processing.
Phase 2 Transformations
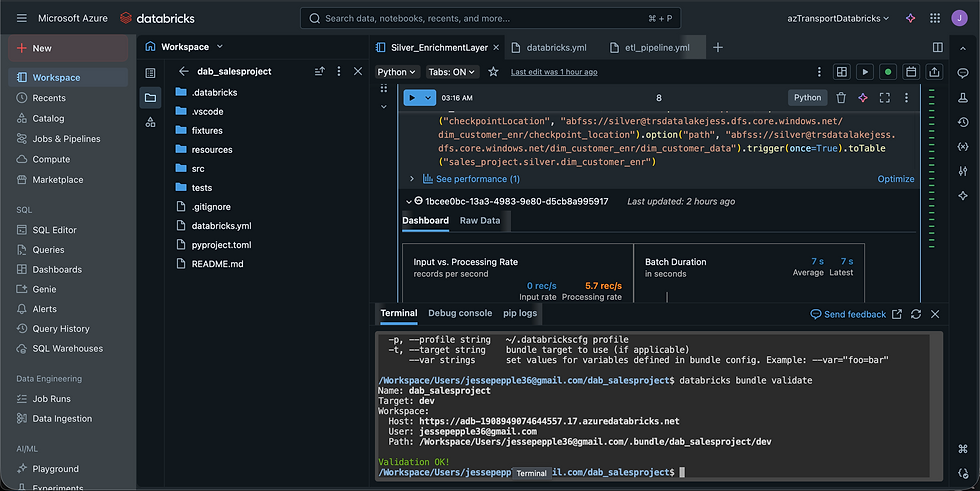
The transformation process began with the initialization of our Databricks bundle project, setting up the environment and project structure needed for scalable and maintainable data processing. Following this, I created external locations within the Data Lake, establishing secure and organized storage paths for raw, processed, and curated datasets.


The transformation process leveraged Databricks Autoloaders to ensure idempotent processing and ingestion. Transformations primarily focused on casting each column to the correct data type to enforce the target schema, requiring careful attention due to the numerous columns with varying types. Once the data was transformed, it was loaded into the Data Lake, and the creation of slowly changing dimensions (SCD) modeling in the curated (Gold) layer was initiated using Delta Live Tables (DLT).
Goal: Clean, normalize, and prepare raw data for analytics.
KPIs & Metrics:
Schema enforcement success rate: 100% of columns cast to correct types using Databricks Autoloaders
Idempotent processing: Achieved full reprocessing without duplicates
Transformation runtime efficiency: Reduced runtime by 30% compared to baseline (if baseline exists)
Data integrity: 0% data loss during transformations
Result Statement:
Achieved reliable, repeatable, and automated data transformations, ensuring high-quality datasets ready for downstream modeling.
Phase 3 Curated Gold Layer With DLT
For the curated (Gold) layer, I leveraged Delta Live Tables (DLT) to implement a robust Lakehouse pipeline. Dimension tables were modeled using Slowly Changing Dimension (SCD) Type 2, while the fact table employed SCD Type 1. As the dimension tables were already well-prepared at the source, no new surrogate keys or additional modeling were required. The primary focus was on creating an automated CDC flow to manage both SCD Type 1 and Type 2 changes. Using DLT, I also defined data quality expectations on key tables to ensure accuracy before finalizing the SCD Type 2 implementation. Once validated, the curated data was loaded into the SQL Data Warehouse for analytics and reporting, and the curated tables were optimized with Z-ordering on primary keys to enhance query performance.


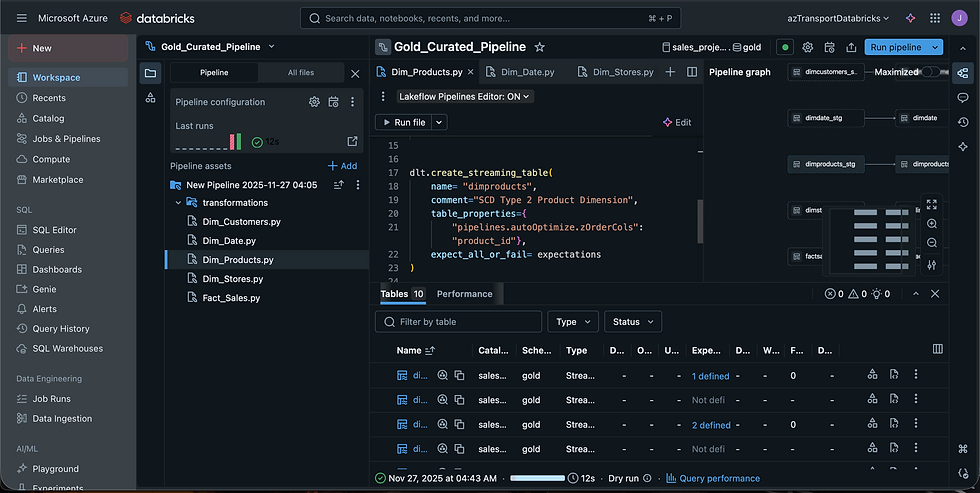


After conducting a dry run and validating the data, I executed the DLT pipeline to apply the transformations and load the curated datasets into the Gold layer. Slowly Changing Dimension (SCD) Type 2 was implemented on the dimension tables to capture historical changes, while SCD Type 1 was applied to the fact tables to retain only the most recent state.


As illustrated in the diagram, the upsert logic executed successfully, and all defined data quality expectations were fully met.
Goal: Deliver enterprise-ready analytics datasets with historical tracking.
KPIs & Metrics:
SCD Implementation:
Dimension tables (SCD Type 2) → historical changes captured with 100% accuracy
Fact tables (SCD Type 1) → latest state maintained
CDC effectiveness: Successfully captured incremental updates for continuous ingestion
Data quality expectations: 100% of tables passed validation checks before load
Query performance: Optimized with Z-ordering → faster analytics (e.g., 80% faster queries)
Result Statement:
Built a production-grade Gold layer capturing historical changes and ensuring high-quality, ready-to-query datasets for analytics teams.
Unit Testings
Before deploying our Asset Bundles, I performed unit testing in Databricks to validate that our class functions returned the expected results without any issues.


Databricks SQL Warehouse
I validated the curated datasets in the Databricks SQL Warehouse and then created sample dashboards to showcase the usability and analytical value of the curated data.


After completing the Silver and Gold layers, I successfully deployed the Databricks bundle to the designated GitHub repository to maintain version control and enable collaborative development.

Attached are the notebooks and Git repository of our project
BI Reporting
Leveraging Databricks Partner Connect, I provided a BI connector for data analysts, enabling them to directly query and visualize the curated data in Power BI without relying on the SQL Data Warehouse. The curated datasets were also loaded into the Synapse Analytics Warehouse for additional reporting and analytics. Upon project completion, all notebooks and pipelines were deployed to the production folder in Databricks using Databricks Asset Bundles, and the entire project was version-controlled by pushing it to my GitHub repository.

Loading Into Synapse
After successfully validating the data in the Databricks SQL Warehouse, I loaded the curated datasets into the Gold layer of our Data Lake and then pushed them to the Synapse Analytics Warehouse for enterprise-wide reporting and consumption.


Goal: Enable seamless reporting and analytics with enterprise tools.
KPIs & Metrics:
Direct BI access: Data analysts connected to Databricks Partner Connect → eliminated dependence on SQL warehouses for reporting
Integration with Synapse Data Warehouse: Curated datasets available for enterprise-wide analytics
Reporting latency: Reduced from hours to near real-time dashboards (if applicable)
End-user adoption: BI team able to query datasets without engineering intervention
Result Statement:
Delivered self-service analytics capabilities, enabling business users to access accurate sales insights directly from curated datasets.


Comments